Share
Bradford has faced challenges in terms of education and skills levels. According to the 2021 census, the level of higher education attainment in Bradford was lower than the national average for England and for the Yorkshire and The Humber region, with a lower proportion of residents having higher education degrees. Additionally, a higher proportion of Bradford residents had low levels of skills compared to Yorkshire and The Humber as well as England as a whole, with a larger percentage of residents having “no qualifications” or “Level 1 qualifications.” These disparities in education and skills levels can have implications for the economic development and prosperity of the district.
According to data from the Office for National Statistics (ONS), in the 2021 census, 24% of the district’s residents reported having no qualifications, which is higher than the national average of 18.2%. In contrast, Bradford has the second highest percentage of residents with no qualifications in West Yorkshire, after Wakefield. On the other hand, the district has lower rates of residents with no qualifications compared to regional and national averages, and this has declined from 27.7% in 2011.
13.6% of the district’s residents aged 16 and over have Level 2 qualifications, which is lower than the 2011 figure of 14.8%. This is equivalent to achieving GCSE grades 9 to 4 or previously graded from A* to C. Meanwhile, 27.4% of residents have a Level 4 or higher qualification, which is higher than the 2011 figure of 21.8%. This is equivalent to having a degree. Although it is higher than the 2011 figure, the percentage is still lower than the regional and national averages, where 33.8% of people aged 16 and above have a Level 4 or higher qualification.
Source: City of Bradford Metropolitan District Council, Intelligence Bulletin (10th Jan 2023).
However, some of these figures represent historic low levels of education. When looking at more recent generations, education levels of young people aged 16 or 17 not in education, employment or training (NEET) are the same in Bradford as for Yorkshire and The Humber (2.9%) and only slightly more than England as a whole (2.6%).13
Likewise, results in 8 GCSE qualifications from the academic year ending 2021, known as ‘Attainment 8’, show Bradford has a score of 45.9, which although slightly lower than the average for Yorkshire and The Humber (49.1) and for England (50.9) are within the average range for the UK, given that scores range from 37.8 at their lowest to 62.0 at their highest.14
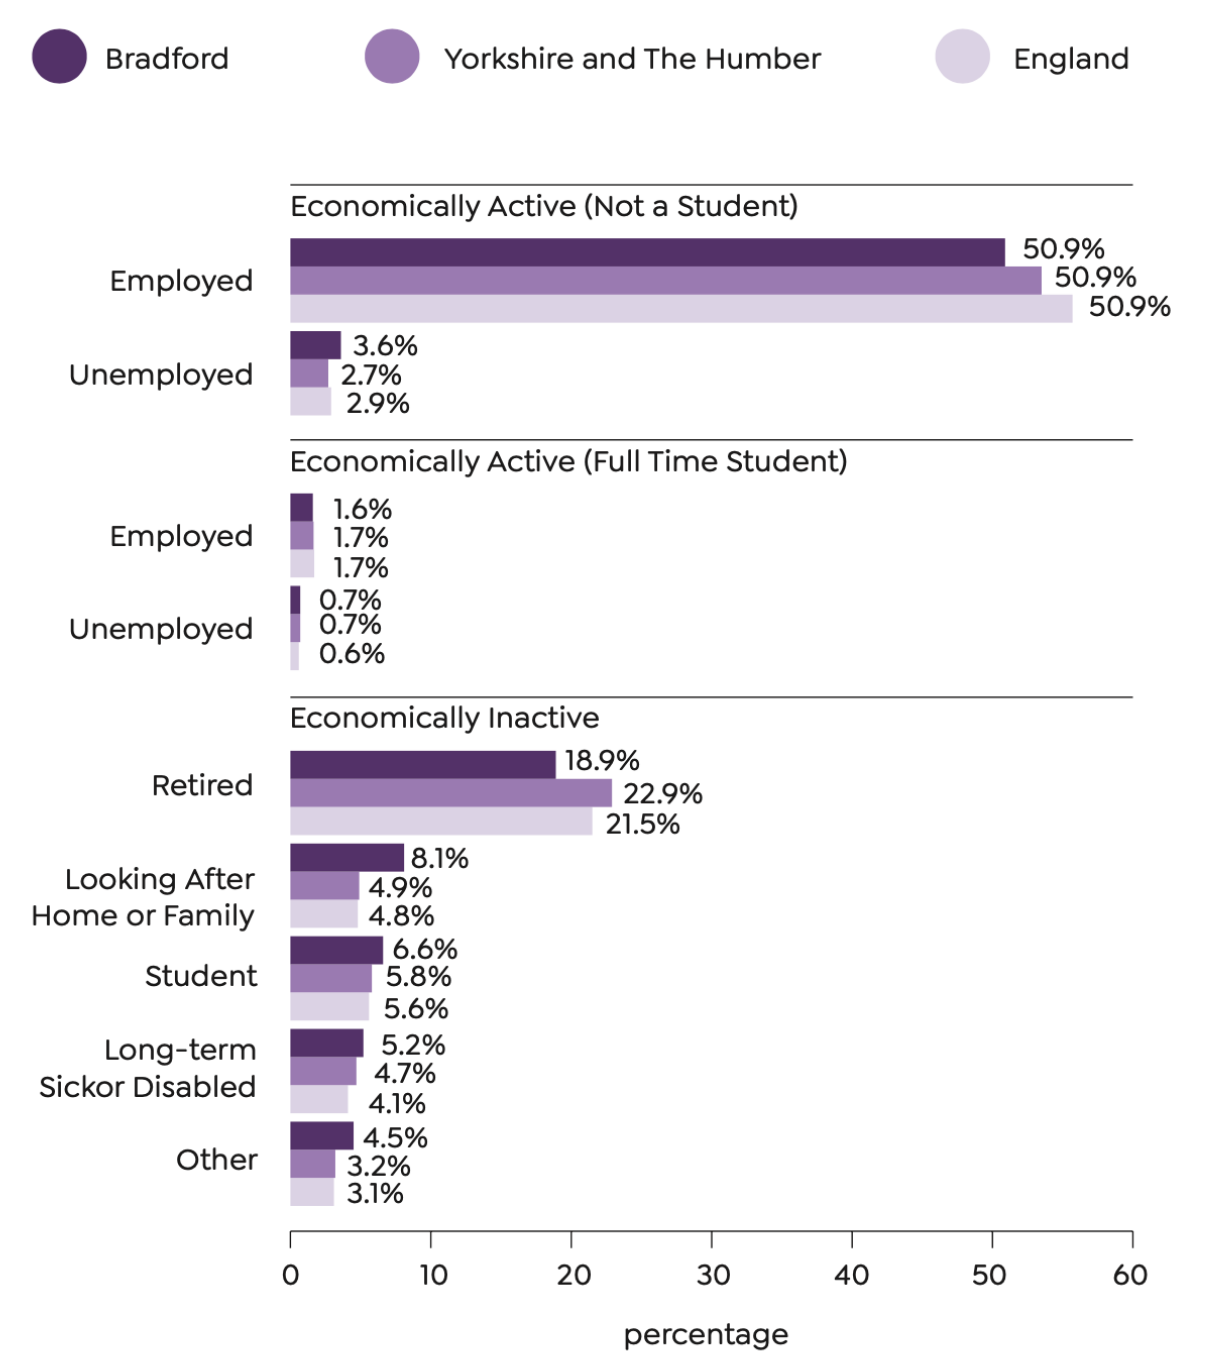
As of the 2021 census, 54.5% of the population aged 16 and over (excluding full-time students) were considered economically active. This means they are either employed (50.9%) or unemployed and seeking work (3.6%). However, Bradford’s employment rate is lower than the national average (55.7%) and is the fourth lowest in the region.
Moreover, 43.2% of the 16+ population are considered economically inactive (not in employment or seeking work), which is higher than the national average (39.1%) and the third highest rate in the Yorkshire and The Humber region.
18.9% of the 16+ population are retired, which is lower than the national average of 21.5% and the second lowest rate in the region after Hull.
Bradford also has the highest percentage of people who are looking after their home or family (8.1%) in the Yorkshire and The Humber region, which is higher than the national average of 4.8%.15

Source: ONS 2021 Census data.
In Bradford in 2021, the largest group (17.1%) gave their occupation as a ‘professional’, followed by elementary occupations (12.0%) and associate, professional and technical (11.5%). Sales and customer service occupations have the lowest percentage (9.1%). The chart below shows a breakdown of occupations for Bradford, Yorkshire and The Humber and England.16
Bradford has less senior, managerial and professional roles than regional or national averages, and more service, sales and manual roles. Bradford also has a higher percentage of people working in the manufacturing industry (9.2%) than England as a whole (7.3%).
Next: Health


Contact us
Bradford Producing Hub
Assembly Bradford
20 North Parade
Bradford
BD1 3HT
Copyright © 2025 Bradford Producing Hub
Website designed and built by Out of Place Studio