2.8. Socio-economic deprivation

This section provides an overview of socio-economic data in Bradford, addressing issues such as poverty, unemployment and deprivation. Data in this section comes from the 2021 Census.

Share

A coat with a sticker reading 'I heart BD'

Headline data

Socio-economic deprivation refers to the lack or scarcity of resources and opportunities necessary for an individual or community to meet their basic needs and have a decent standard of living. In Bradford, like in many other local authorities in the UK, there are areas and communities that experience high levels of deprivation, leading to a range of social, economic and health problems. Some of the indicators of deprivation in Bradford include low income, poor-quality housing, high unemployment, low educational attainment and poor health outcomes. 17% of households in Bradford experience multiple forms of deprivation. These factors often intersect and reinforce each other, creating a cycle of poverty and disadvantage that is difficult to break.

5.6% and 28.9% of children in Bradford come from households living in absolute and relative poverty respectively (compared to 24.2% and 31.3% for Yorkshire and The Humber and 24.5% and 30.8% for England).

The Index of Multiple Deprivation (IMD) is the recognised means of measuring deprivation at the local scale. The latest edition of the IMD was published in September 2019 and shows that Bradford is the 13th most deprived local authority in England. Bradford’s position has worsened by six places since the last IMD publication in 2015.

Key bullet points

  • A third of families in Bradford are experiencing poverty, with 17% experiencing more than one form.
  • Unemployment rates in Bradford are high (7.1%) compared to England (3.8%), but there has been a reduction in the past year.
  • Some parts of Bradford have high levels of deprivation while others are relatively prosperous, although the District overall is ranked as the 13th most deprived local authority and has worsened six places since 2015.

In total, 17% of households in Bradford experience multiple forms of deprivation. 22% of children are living below the poverty line, 15% of people are experiencing fuel poverty and the local authority district is ranked the 5th most deprived of income and 6th most deprived of employment in England. Rates of unemployment in Bradford are high – 7.1% compared to 3.8% for England.

However, there are signs of improvement – there was a reduction of over 20% in levels of unemployment in the last year and self-employment in Bradford has grown 23% in the last 10 years.

In comparison to other cities in England, Bradford has a larger percentage of LSOAs (Lower Super Output Areas) that suffer from high levels of income deprivation in the top 30% bracket. The Index of Multiple Deprivation (IMD) rankings were used to measure the percentage of localities in each city that fall into each decile (1-10) of deprivation, with decile 1 representing the 10% with the highest levels of deprivation in England.

Bradford is also in the lowest 20% of the country for median earnings, has fewer schools rated ‘Outstanding’ by Ofsted and has one of the 20% largest earnings gaps between the lowest and highest resident incomes, signifying reduced opportunity.

Table 3: Indices of Multiple Deprivation in England 2019

City Decile 1 (highest 10%) Decile 2-3 Total in highest 30%
Bradford 28% 26% 54%
England 10% 20% 30%
Sheffield 23% 17% 40%
Newcastle 28% 19% 47%
Gateshead 16% 36% 52%

Source: English indices of deprivation 2019.

Figure 9: Indices of Multiple Deprivation map of Bradford 2019

Source: City of Bradford Metropolitan District Council, Intelligence Bulletin (4th October 2019).

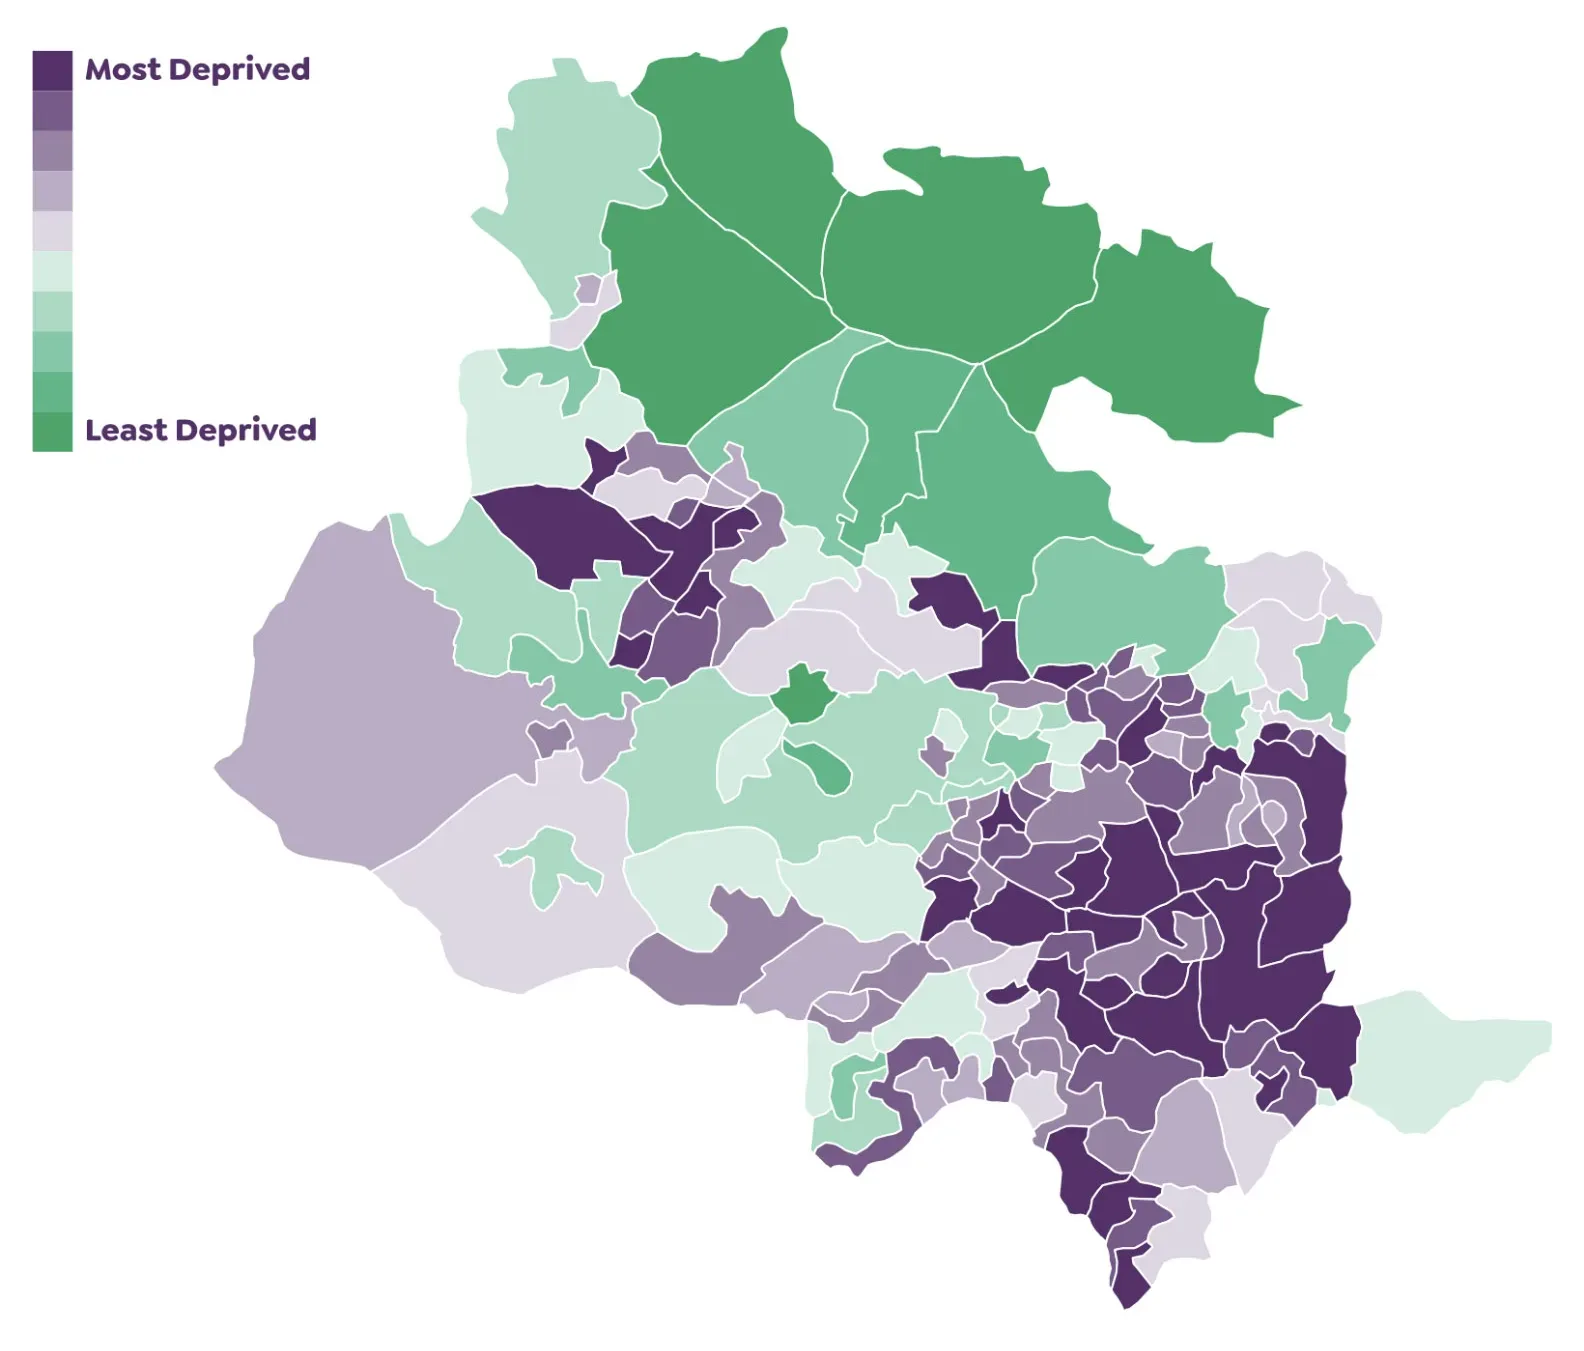
There are significant local socio-economic variations within the Bradford area. The data above does not reflect the differences at the local level within the Bradford district. The least deprived areas are mostly in the north of the district in Ilkley, Burley in Wharfedale, Menston, Bingley and rural villages around. Areas suffering from the highest levels of deprivation include the local areas in and around central Bradford such as Bradford Moor and Manningham and outlying Bradford housing estates - particularly Holme Wood, Ravenscliffe, Buttershaw and Allerton, and Keighley.

2.1. Diversity

Bradford is a highly diverse district, reflecting the unique ethnic, religious and socio-economic backgrounds of its residents.

2.2. Ethnicity

The district also has a high percentage of Asian/Asian British, with 26.8% of the population identifying as such.

2.3. Religion

In Bradford, Christians form the largest religious group at 33.4%, followed closely by Muslims at 30.5%. Additionally, 28.2% identify as having no religion.

2.4. Disability

Overall, 19.0% of Bradford residents identify as disabled. This is slightly higher than Yorkshire and The Humber at 18.9% and 17.7% in England.

2.5. Age profile and gender

Bradford has a balanced gender ratio, with 50.5% female and 49.5% male residents and is among the youngest metropolitan districts in the UK, with a median age of 36.7.

2.6. Skills, education and employment

This section provides data on skill levels and educational outcomes in Bradford. This draws on data from the 2021 Census, and other sources highlighted, such as comparators with Yorkshire and The Humber.

2.7. Health

This section provides an overview of health data, addressing issues such as life expectancy, health outcomes, illness and wellbeing.

2.9. Gaps in the data

Although extensive research exists on the demographics and diversity of Bradford district, there are notable data gaps crucial for arts organizations.

2.10. Opportunities

The district arts organisations can harness data to tackle entrenched issues, leveraging Bradford’s diversity and deprivation for impactful social change.

Latest news and events

View our latest news and events

Skip to content